Project: Abel’s Theorem Animated
Project supervisor: Alex Furman
Student researchers: Veronica Kalicki, Juan Morales, Ryan Ostrander
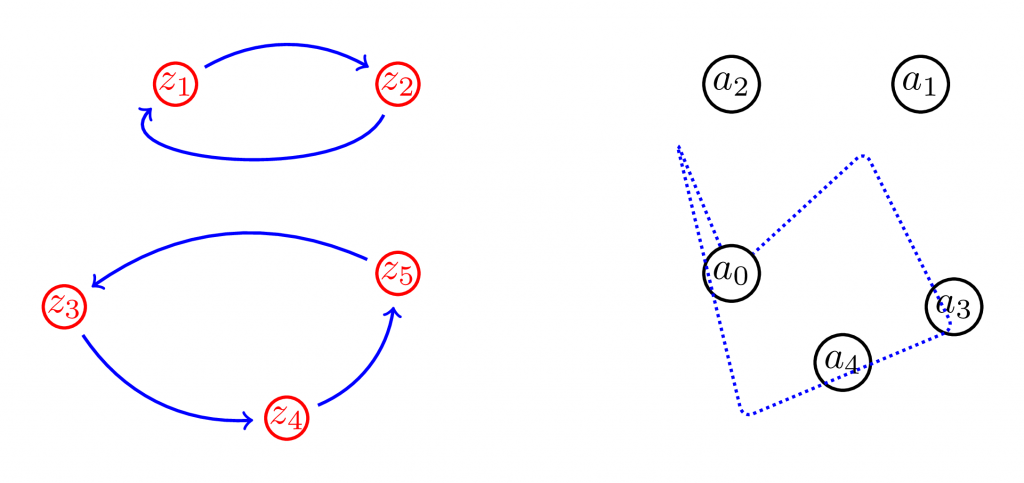
Description: The formula for solutions of the quadratic equation z2 + a1z + a0 = 0 is familiar from high school algebra; they are given by
There exist more complicated, yet similar, formulae for the solution of the cubic and the quartic equations.
However, in 1824 Abel proved that there cannot be a formula, using radicals and elementary functions, that would express the solution of the quintic equation
z5 + a4z4 + a3z3 + a2z2 + a1z + a0 = 0 in terms of the coefficients a0, …, a4. In 1963 Arnold gave a geometric explanation of Abel’s theorem that revolves around motion of points in the complex plane and the images of these motions under functions and radicals. The goal of the project is to demonstrate these ideas visually through an interactive web application.
Outcomes:This project involved creating a graphic illustration of an argument due to Arnold, proving Abel’s theorem. In modern language it uses monodromy of configuration space to prove that any expression that uses analytic functions and radicals applied to the coefficients of a quintic could not possibly trace the roots of this quintic.
To illustrate this idea we developed javascript code that displays on a split screen certain movement of the 5 roots on one side, the corresponding movements of the coefficients of the corresponding quintic on another, an application of some (any) analytic expression in those coefficients, and some radicals. One designs a motion of the roots that start and end in the same set of distinct complex numbers, where individual roots undergo a permutation, and such that the expression necessarily follows closed loops. Since the original roots were permitted, such an expression could not consistently follow them in the process. This becomes evident in the resulting animation.
Materials and resources:
Project: Interactive configuration spaces
Project supervisor: Jānis Lazovskis
Student researchers: Stephanie Nguyen, Vanessa Trujillo, Adi Vandanapu
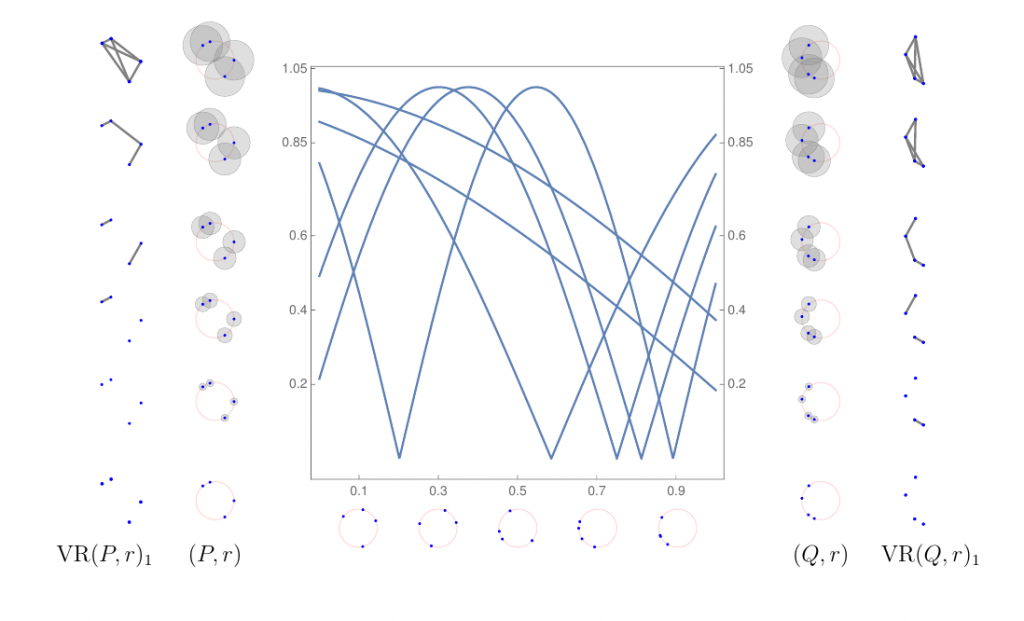
Description: Given points in space, we can connect ones that are close to each other and build simple shapes. As the points move around (that is, as the initial configuration changes to another configuration), how do these simple shapes change? The precise ways to define these shapes and the general structure of these “configuration spaces” give insight into how complex data can be approximated in an understandable way. This project will be about exploring the foundations of topological data analysis and creating an interface through which users can interact with the data.
Outcomes: We set out to understand the configuration space of 3-dimensional space and the map that assigns a simplicial complex to an element of the configuration space. The motivation was from persistent homology, a powerful tool in algebraic topology that has found uses in practical applications. Our goal was to let the user experience interactively the creation of a simplicial complex.
Working in Unity to create a virtual reality scene for the Oculus Rift and Touch controls provided challenges of its own. We learned how to code in C#, how to use the built-in objects and scripts from Unity, and how to keep track of changes with the git version control system. Ultimately, we succeeded in realizing an interactive scene for the user to create, destroy, and move points in 3-dimensional space, all the while seeing a real-time updated simplicial complex image in front of them.
Materials and resources:
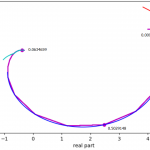
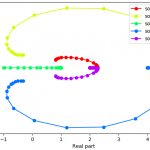
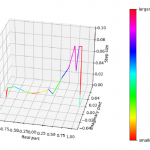
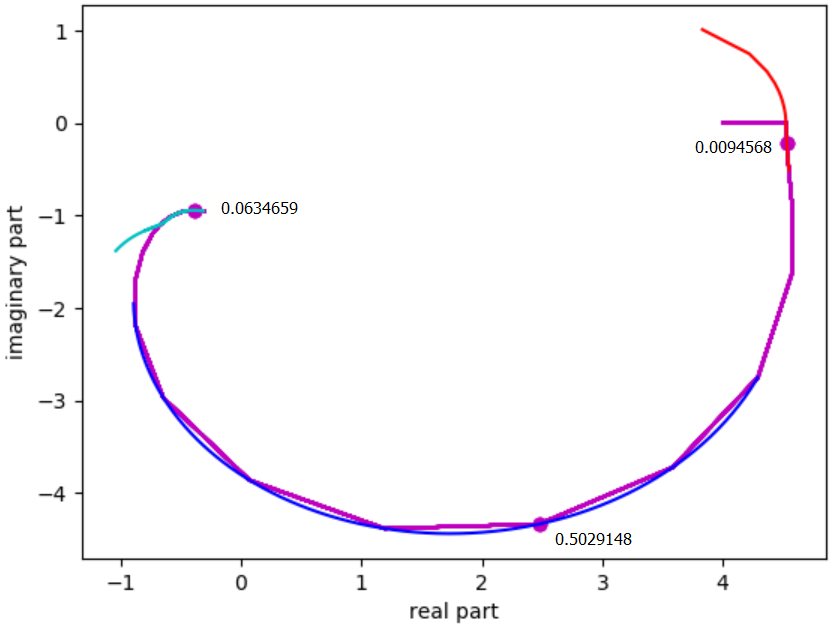
Project: Solution curves of families of polynomial systems
Project supervisor: Jan Verschelde
Student researchers: Jakub Dlugosz, Kevin Mazzarella, Anja Schulz
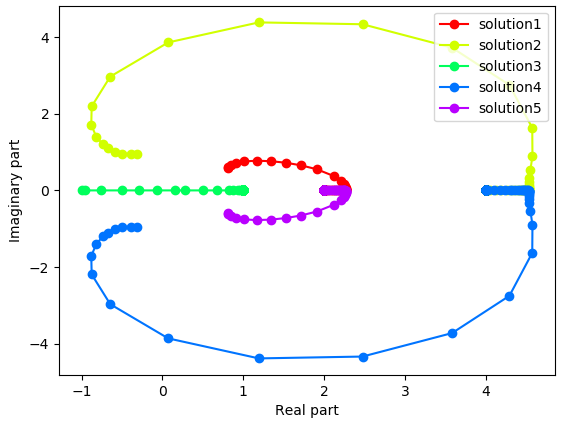
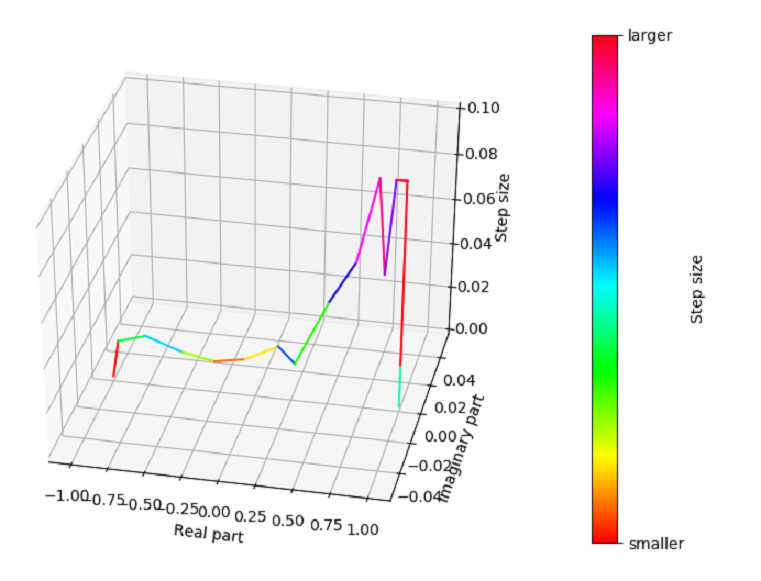
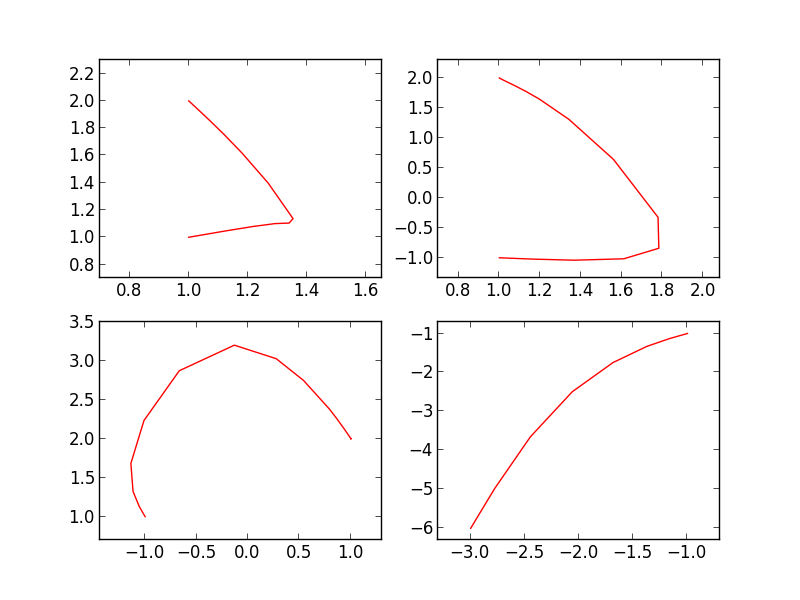
Description: A numerical solver of a polynomial system deforms a systems with known solutions into the given system. The solution curves originate at the known solutions and end at the solutions of the given system. How difficult a system is to solve depends on the difficulty of the solution curves. The goal of the project is to visualize the solution curves and the nearest singular points to the curves.
Outcomes: We worked toward providing a convenient means of extracting human-readable data from phcpy, a Python interface to the PHCpack software package, and providing a convenient means of visualizing this data. PHCpack implements homotopy continuation methods for the numerical solution of systems of polynomial equations, and phcpy provides a Python wrapper for PHCpack’s functionality. The PHCpack path tracker generates a large amount of data each time it is run (lists of high-precision floating-point numbers representing coordinates in space, coefficients of power series, roots of polynomials, etc.). This data is represented in phcpy in a form most useful for occasional debugging and is not shown to the user by default. However, it contains information relevant to understanding the behavior of the path tracking algorithm used by the software and for this reason is interesting in its own right.
We therefore developed two collections of Python functions facilitating the study of this data: one which provides phcpy users with finer-grained control over the data returned by the path tracker than is provided by the built-in modules, and another which directly creates plots and animations from the filtered data. Creating these functions required learning how to interact with PHCpack at the lowest level possible through phcpy, experimenting at length with Matplotlib to find the best ways of visualizing different sorts of path tracker data, and integrating the code these two activities produced so that a user of phcpy can visualize the data produced by the path tracker without having to understand the package’s internals.
Materials and resources:
- Poster
- Source repository
- Sample output: